Distributed systems are complex software machines that are made of many autonomous services that work in concert. Engineers who are charged with the care and feeding of these complex systems rely on a variety of tools to keep them informed about overall system health. When one piece begins to fail, it could cause cascading failures or system-wide performance issues if left unattended.
Tracing tools let engineering teams understand how data travels between different services within a distributed system. By monitoring and reviewing trace data, engineers can spot performance bottlenecks and other discontinuities between services. These data help pinpoint exactly what needs to be fixed when problems arise. In the era of microservices, end-to-end insight across myriad collaborating services is essential.
In this article, we’ll take a look at distributed tracing in AWS-hosted APIs using New Relic and how Fullstory session replay URLs can be used with New Relic tracing to provide a view into the user experiences corresponding to the trace data. This additional insight can reduce the time it takes your team to understand and fix issues in your web applications.
Distributed Tracing with New Relic
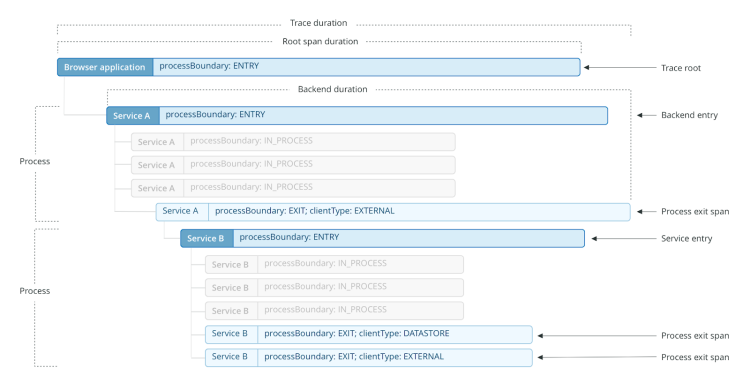
New Relic is a widely adopted APM (Application Performance Monitoring) platform. They provide server-side agents that cover a variety of languages for monitoring application health. These agents will decorate HTTP requests between services with a set of HTTP headers that are tracked by New Relic as they flow through the service network in a distributed system. This trace data is visualized as a tree-like collection of “spans” that map to service calls and service process durations.
New Relic's view of distributed tracing. Find more details here.
New Relic has a convenient AWS Lambda integration that you can use to quickly instrument Lambda functions (it only takes a few minutes) and trace calls to other AWS services like DynamoDB. Since it’s so easy to get going with New Relic on AWS Lambda, we’ve chosen to build our distributed tracing example with AWS API Gateway, AWS Lambda, and DynamoDB.
If you’ve already built “serverless” applications in AWS, you can use the examples in this article directly (follow these steps to link your AWS account with New Relic and instrument your AWS Lambda functions). If not, the same patterns we cover in this article apply when using other hosting platforms. Check out New Relic’s list of agents to find one that’s right for you.
Tracing + Session Replay Provides A More Complete Context
Trace data can point to things that are going wrong within your users’ digital experiences. Long spans corresponding to a particular service call might translate into a sluggish app experience, for example. Spans that contain errors could mean a user experience is completely broken. However, it’s impossible to really gauge the severity of user impact by looking at trace data alone.
This is where Fullstory session replay URLs can help. These are deep links to session replays that you can watch to understand what users were experiencing when a trace anomaly occurs. You can also observe behavior prior to something going wrong in the trace to understand whether any precipitating user events may have triggered the issue.
To demonstrate how you can use New Relic and Fullstory together to extract greater insights from trace activity, we’ve created a fake ecommerce site called Reactshoppe. In this example, New Relic will be providing server-side observability and Fullstory will give us the client-side observability we need to get a complete understanding of every interaction on our site.
You can buy fruitte on Reactshoppe
The engine powering this ecommerce extravaganza is the Reacthoppe API, which is built in AWS using AWS Lambda, API Gateway, and DynamoDB. The stack is managed with AWS CDK.
This API has been deliberately hobbled to make for a more interesting New Relic integration.
The call to DynamoDB is busted!
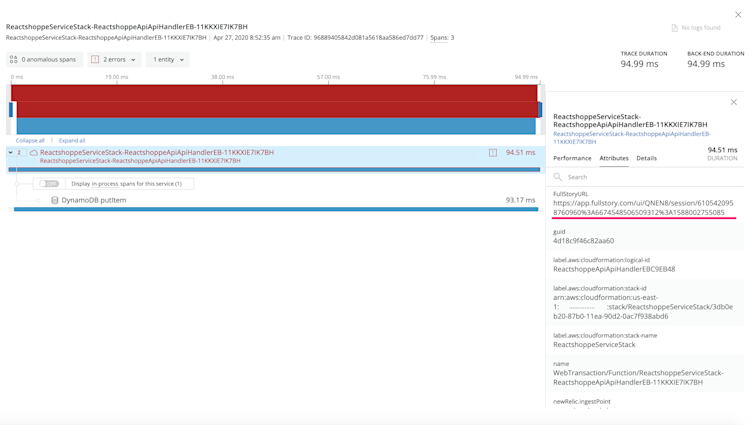
When a call is made to the Reactshoppe API, a Fullstory session replay URL is included in the Attributes collection on the root span of the trace in New Relic.
A Fullstory session replay URL is embedded as a Root Span attribute.
There are only two spans in this trace: the AWS Lambda function handler and the call to DynamoDB. If you copy/paste the FullstoryURL attribute value, you’ll be taken to the moment in the replay where the root span begins.
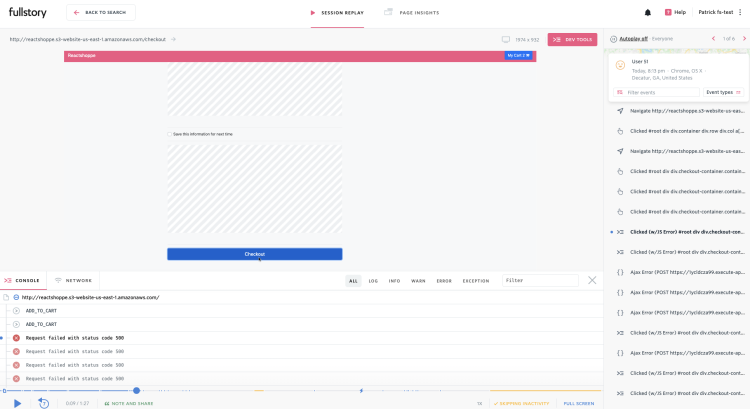
This is the moment when the issue occurred in the user's experience.
In Fullstory, excluded elements are displayed as diagonal gray bars (pictured above) during replay. In this case, the billing and payment information has been blocked. You can learn more about Fullstory’s industry-leading privacy controls here.
As you can see, this user is trying to check out but is unable to do so.
The checkout failure as captured by Fullstory
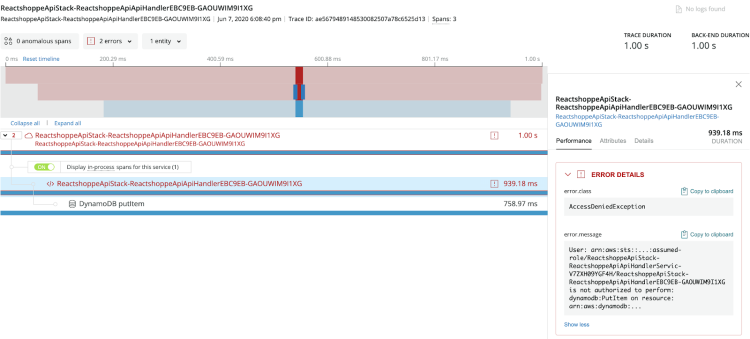
Fortunately, New Relic also includes error details for spans where errors occurred.
Error spans also include error details
In this example, the trace pointed us to an issue in our system. The Fullstory session replay gave us a view into the user impact of the error (it’s bad). Our intrepid engineering team now has all the data they need to prioritize a fix.
Stitching New Relic and Fullstory Together
Assuming you have a New Relic agent running in your hosting environment (in this example, we’re using the AWS Lambda node agent), there are three things you need to do to get Fullstory session replay links into New Relic traces:
Include a session replay link as a request header in all requests to your services from the browser.
Update your CORS policy to accept this header.
Decorate your root spans with the newrelic.addCustomAttribute agent API call.
Step 1 - Adding a Session Replay Link Header
The session replay URL is added as a request header in the browser application. The Reactshoppe app uses the axios bowser library to generate HTTP requests. Axios includes the ability to intercept requests globally and change their payload via interceptors. This is how the session replay URL is added as a header:
We are using the getCurrentSessionURL function of the Fullstory browser SDK.
Step 2 - Update Your CORS Policy
In our example, the CORS policy for the Reactshoppe API must allow the “X-Fullstory-URL” header in order for the API call to function. This CORS header policy is set in a couple of places, on the preflight OPTIONS response in the API Gateway configuration…
...and in the response from the Lambda function that handles the request:
Step 3 - Decorate Your Root Spans with Custom Attributes
On the entrypoint for the backend service, the “X-Fullstory-URL” header value is sent to New Relic with the newrelic.addCustomAttribute node agent API call:
Once these three steps are complete, you’ll see Fullstory session replay URLs attached to all of your root spans in New Relic traces.
Make Replay the Key to Understanding the Impact Behind Your Traces
Without a view into your users’ experience, it’s almost impossible to completely understand the impact of trace anomalies. You could be prioritizing fixes without a full understanding of the data. By layering in Fullstory session URLs, you get complete context and can prioritize with all the necessary information.
Furthermore, seeing user behaviors prior to issues that show up in the trace will give you a much better understanding about what caused a problem in the first place. When you put all of these things together, Fullstory session replay paired with New Relic tracing should give you a lead on faster time to remediation for any problems with your web apps.
You Might Also Like
Understanding React + Redux errors with Sentry and Fullstory
Seeing is believing: Generating screen captures from session recordings
Easing component discovery with our babel annotate React plugin
