Creating thumbnail "screenshots" with session replay and Puppeteer.
Building the technology required to power a complex product like Fullstory means routinely solving unique problems with non-routine solutions. Today, we’ll talk about one of these solutions—how we made it easy to identify specific moments from a user's digital experience by generating thumbnails (a.k.a. screen captures or screenshots) from their session, as logged by Fullstory.
You might be thinking, "Screenshots from replaying sessions ... how hard could that be?" If so, that's a testament to the seamless experience of replaying user sessions in Fullstory. This is because when you replay a user session in Fullstory, even though what you're watching seems like a video recording, it is really a complex re-enactment—like a play—of all the little things the user saw on screen (See the Guide to Session Replay). In other words, generating a screenshot is not like grabbing a frame from a video; it's more like conducting a play on demand and at a specific moment in time and then taking a photo of that exact moment, just how it happened.
That's far from easy.
So in this post, we'll cover how we brought thumbnails from proof-of-concept to production ready, walking you through each aspect of the implementation. You’ll get a sense for how real-life software is built, and in particular, how distributed systems come together.
Let's get started!
Passing Notes
A useful feature of Fullstory is the ability to take notes and comment on sessions during replay. Here's how it works: Let’s say you’re watching a Fullstory session and you notice something you don’t want to forget, so you make a comment. The "Note" gets attached to the session recording at a specific moment, and a link is generated directly to that Note in Fullstory. Notes make it easy to collaborate within or across teams. You can share Notes with other users from within Fullstory—or share them via integration with tools like JIRA and Slack. Within the Fullstory app, you can review the “All Notes” page to quickly see all of the recent notes left by you and others.
Up until the beginning of 2019, Notes would show up as text-based cards in Fullstory that included the name of whoever left the comment, a link to the corresponding moment in the recorded session, and more. This worked well enough, except for one thing: the Note cards were a little too abstract. They lacked a visualization of what the Note related to—a snapshot of the digital experience at the time of the comment. This made it hard to scan the notes quickly.
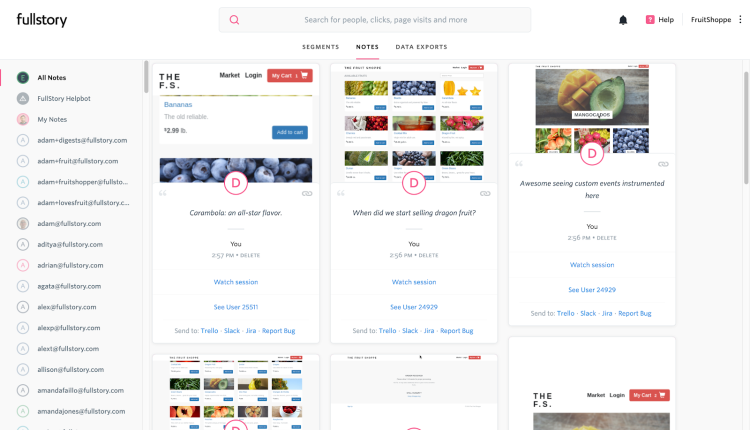
We decided Notes needed screenshots, thumbnails to help the user see what the page looked like when the comment was created. And so we built thumbnails for Fullstory Notes:
As you can see, thumbnails now appear above each of the Notes on the "All Notes" page. While the thumbnails are not earth-shattering, they add a certain je ne sais quoi to the page. 👌They make it easier than ever to quickly scan the page and find a Note that catches your eye.
Great. So how do thumbnails work?
Master of Puppets
Fullstory’s session replay platform is, of course, a core component of the thumbnails implementation. By leveraging it, we can begin replaying a session, pause it at the right moment, and generate a screenshot. This screenshot can then be shrunk down and saved elsewhere to be used as the thumbnail. Done!
This is a good idea. However, implementing it is more complicated than it seems. How do you convince an intern to sit and do this manually every time a Note is created? Obviously, you can't. And that's why we decided a humorless machine would have to shoulder the burden instead.
Enter the Puppeteer library, built by the Google Chrome team. Puppeteer is a Node.js library that allows you to programmatically control headless instances of Google Chrome and its open-source cousin Chromium.
If you aren't familiar with the concept of a headless browser: it’s a fully functional web browser, but one that does not generally render the page to the screen or accept user input. Instead, it is controlled via an API by external tools. This means that it can navigate to pages, log-in, submit forms, execute Javascript, etc. It’s everything you'd expect of a browser, maybe short of having extensions, bookmarks, or similar "quality of life" features. Typically, you encounter headless browsers in the context of automated user interface tests—such as through popular tools like Selenium and Nightwatch.js—which are able to manipulate headless browsers using a scripted series of steps to verify that your website’s functionality has not substantially regressed.
By leveraging Puppeteer and its ability to drive headless Chromium on our behalf, we had a way to power our session replay technology—and generate those moments we needed to screenshot—without having to perpetually caffeinate any humans. This solution could open and close the browser instance, navigate to the session replay page, and pipe the requisite data across the wire. Both spooky and useful, it could even support taking a screenshot of a page that it has not rendered out to the display! Just hit the right timestamp during playback and Puppeteer creates an image we can then buffer out to a file.
Head in the Clouds
How does all of this play out in practice? Let’s look at some details.
First, when a Note is first created inside the Fullstory app, we place a message in a task queue. The message is just a small amount of data describing the session, such as display dimensions and resolution, and the point in time we'd like Puppeteer to take the screenshot.
Next, the message will be pulled from the queue by a task handler, which will validate the request and begin fetching the necessary event bundles for the page. (Event bundles are what drive session replay here at Fullstory.) The bundles are sent alongside the rest of the request to a Google Cloud Function, which orchestrates the thumbnail creation.
Here, the function navigates a fresh browser instance to the rendering iframe and injects the request parameters into the page:
const handler = async (req: Request, res: Response) => {
  const parameters: Parameters = { ... };
  const browser = await puppeteer.launch();
  const page = await browser.newPage();
  // exposeFunction adds a "bootstrap" function to the window object. It simply returns the parameters found
  // in the request body, including the event bundles, so that we can feed them to the rendering iframe.
  await page.exposeFunction('bootstrap', () => parameters);
  // Navigate to the playback page, which will simulate session replay.
  page.goto(`file:${join(__dirname, 'headless_playback.html')}`);
  // Continued below.
};
Inside the browser, the headless_playback.html begins sending the event bundles over to the renderer:
// This script runs inside of the headless browser, not Node / GCF.
(async () => {
  const parameters: Parameters = await window['bootstrap']();
  const [renderer, host, iframe] = openChannelToRenderer();
  // Point the playback iframe to the renderer
  const rendererUrl = buildRendererUrl(parameters);
  iframe.setAttribute('src', rendererUrl);
renderer.playPage(parameters.page);
  await host.ready();
  renderer.playToTime(parameters.playToTime);
  // Signal to Puppeteer that rendering has begun
  iframe.style.visibility = 'visible';
})();
Now, at this point, our code is simulating session replay inside of a headless browser, purely for the purpose of extracting a thumbnail from the playback. Pretty cool! When rendering is finished, we can proceed to take the screenshot, do some quick resizing (via sharp), and pipe the resulting image out through the response. Back in the request handler:
 // We're only interested in the contents of the renderer
 const boundingBox = await getBoundingBox(renderer);
 // Wait on Puppeteer to generate a screenshot of the page
 const screenshot = await page.screenshot({ clip: boundingBox });
 // Resize the image while maintaining aspect ratio. This should be sufficiently
 // large for most use-cases while reducing storage costs and page load speeds.
 const resized = sharp(screenshot).resize({ width: 800, withoutEnlargement: true   }).toBuffer();
return res.set('Content-Type', 'image/png').send(resized);
The task handler that sent the original request to the Google Cloud Function will then buffer the image out of the response into a file, where we can store it for use as a thumbnail.
You Know What They Say About the Best Laid Plans ...
So far, the implementation is pretty solid. It just has one hurdle: we need to ensure the page is fully loaded and rendered before we proceed with the screenshot, rather than leaving it to guesswork. Otherwise the thumbnail could end up a garbled mess:
Yep, that's it. White space and all. It goes without saying, this is not what the website looked like at the time in question.
Oof!
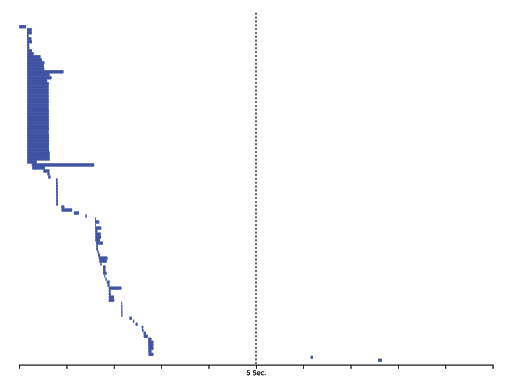
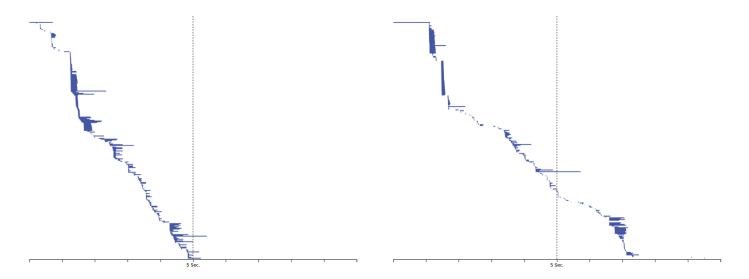
A simple solution to this problem would be to just wait a predetermined amount of time, say 5 seconds. But does this solution actually work? We recorded the network activity for a handful of websites out in the wild and compiled the data into the diagrams you see below. Each row represents an individual network request, moving from left to right through time, so rows stacked on top of one another indicate concurrent network requests.
Above, you can see each network request made by the browser. For our purposes, we used this analysis to understand how long it takes to load a page. As you can see in this case, all requests were complete after about 3 seconds. You can pull these Gantt-like visualizations on your own by opening up the Developer Tools panel in your browser.
Now, in this first example, you can see the page initiates many requests simultaneously and they all finish relatively quickly. A+! The only drawback? Since we’re forced to wait the full 5 seconds, our code will continue to execute an additional (wasted) 2 seconds.
Let's take another example. Here, most of the requests finish with ample time to spare. Only if you look closely, there are two straggler requests who land past the 5 second mark. Our code would miss these.
Here, you can see almost all network requests are done after 3 seconds ... except if you look closely, there are a couple more that sneak in after 5 seconds.
Finally, look at these two pages. Both have requests that do not finish within our 5 second window ... and are lost. Hopefully those requests aren’t anything important like, say, a stylesheet or logo.
These two last examples show how network requests can often drag out over many seconds.
Finally, two more pages whose requests do not finish within our 5 second window and are lost. Hopefully those requests aren’t anything important like, say, a stylesheet or logo.
We now know that for some pages, the 5 second cut-off will be too short. The resulting thumbnail could end up looking like an unstyled or partially loaded page. And for others, 5 seconds will be far too long, wasting time, money, and electricity on running code that has nothing to do.
Of course, 5 seconds is just an arbitrarily chosen cut-off. Adjusting it up or down does not fix either of our problems, so there really is no correct number here. What were we to do?
Writing code that gets it right for every flavor of website out there is going to be very hard—and as every seasoned web developer knows, all we're trying to do here is cope. So here's how we coped: we gave the thumbnail function two heuristics: network activity and rendering activity.
Holding the Door Open for Network Activity
As you just saw, whenever the browser begins loading a modern webpage, it fires off a huge wave of requests in the background. It has to fetch all of the necessary fonts, stylesheets, scripts, images, and animations (the list goes on and on). As each of these requests finishes and the network activity “settles down,” we know the page is on its way to being presentable. So this “settling down” is our first indicator.
Luckily, Puppeteer turns this vague concept of network activity “settling down” into a precise notion for us. It has a handful of waitFor* functions, including page.waitForNavigation([options]). This function takes a normal timeout as an option, and in addition it also accepts a waitUntil parameter that can be any of:
load - consider navigation to be finished when the load event is fired.
domcontentloaded - consider navigation to be finished when the DOMContentLoaded event is fired.
networkidle0 - consider navigation to be finished when there are no more than 0 network connections for at least 500 ms.
networkidle2 - consider navigation to be finished when there are no more than 2 network connections for at least 500 ms.
Of the options above, we are interested in the bottom two since they give us a convenient way to measure network activity on the page. Thus, ideally, all of the network requests would finish quickly and Puppeteer would signal networkidle0 right away, allowing the screenshot to proceed. In practice some websites tend to have long-running but nonessential requests—or a recurring request that could prevent the networkidle0 condition from ever being satisfied. (These are the stragglers in example #2 above.) That leaves us with the more practical option—networkidle2. If all but two requests have completed in a 500 millisecond window, we consider it good enough.
What if those last two requests finish just outside the window? Catching the resources that load at the very last moment could make or break our thumbnail. This is that uncomfortable grey area you encounter when holding the door open for others. You should probably just let the door quietly shut, but you don’t. You insist on standing there with a half-hearted smile on your face as your victims do that awkward rush over to the door. This is that same dilemma, but in Javascript. Thankfully, it turns out we can reach a decent compromise without a lot of additional complexity using Promise.race:
// Proceed after either condition is reached. networkidle0 is preferable, but
// networkidle2 plus a small fudge factor is also acceptable.
const waitForNetworkIdle = async (page: Page): Promise<()> => {
  const networkidle0 = async () => {
    return page.waitForNavigation({ waitUntil: 'networkidle0' });
  };
  const networkidle2 = async () => {
    await page.waitForNavigation({ waitUntil: 'networkidle2' });
    return page.waitFor(1000);
  };
  return Promise.race([
    networkidle0(),
    networkidle2(),
  ]);
};
Promise.race accepts a list of promises. Whenever any of them resolve, no matter the order, Promise.race will also resolve. If the page hits networkidle0 quickly, great! Otherwise, we're willing to hold the door open slightly longer for networkidle2.
Rendering Activity
The second indicator is rendering activity: as the page finishes loading and rendering to the (hypothetical) screen, there will be natural fluctuations in the amount of work the browser is doing. It will mostly be active, but there can be periods of inactivity or idling in between. We can queue up a function to be invoked during that browser idling using window.requestIdleCallback, which takes a function as a callback and an optional timeout.
(Mind that requestIdleCallback is not a standard browser function and will not be available everywhere. Notably, there is no support for requestIdleCallback in Internet Explorer, Edge, or Safari. Since we're relying on Chromium for thumbnails, this is a safe choice, even though it's non-standard.)
In practice, the browser may fire several idle callbacks throughout a typical page load. So only after the page reaches network idle do we register the callback:
const [idleState, renderer] = await Promise.all([
  waitForNetworkIdle(page),
  page.waitForSelector('#rendering-frame', { visible: true })
]);
// Tell the browser-side code we're ready for the requestIdleCallback
// by invoking a custom function we placed on the window object
await page.evaluate('window.scheduleRequestIdleCallback()');
Over in the browser, on the headless_play.html page:
// Wait for the browser to signal that it is idle by using requestIdleCallback,
// or proceed after a short timeout if necessary
window['scheduleRequestIdleCallback'] = () => {
  const callback = () => {
    window['onRequestIdle'] = true;
  };
  window['requestIdleCallback'](callback, { timeout: 5000 });
};
And back in the Cloud Function, waitForFunction polls onRequestIdle on the window object and waits for the condition to return true:
// The network is idle and the rendering frame is visible;
// just waiting on an idle callback from the browser
await page.waitForFunction('window.onRequestIdle');
It may seem like a lot of work, but this extra effort helps ensure we produce good looking screenshots. If the browser is signaling that it is still working hard to render the page, either through network activity or delaying the idle callback, we're willing to wait around (up to a point, anyway).
Progress!
I See What You Did There: Visual Regression Testing
With our network and rendering heuristics in place, let’s talk about testing.
Constant change within a codebase will eventually lead to some broken features. To prevent these feature regressions from accidentally being shipped to the world, modern software engineering practices dictate your code is covered by a variety of automated tests, chiefly unit tests and integration tests.
Thumbnails pose an additional challenge that cannot be easily tested by conventional methods: the code may advance from A to B to C without ever throwing an error even while generating a completely malformed thumbnail image! We need to reliably create thumbnails on-demand and at scale ... so we'll need a way to mitigate this issue.
There are a few possible approaches to consider, such as using traditional feature detection to reason about the quality of the image (e.g. by differentiating a blank webpage from one that is fully styled and rendered). Let's just cover one approach that has proven to work well in practice: visual regression testing.
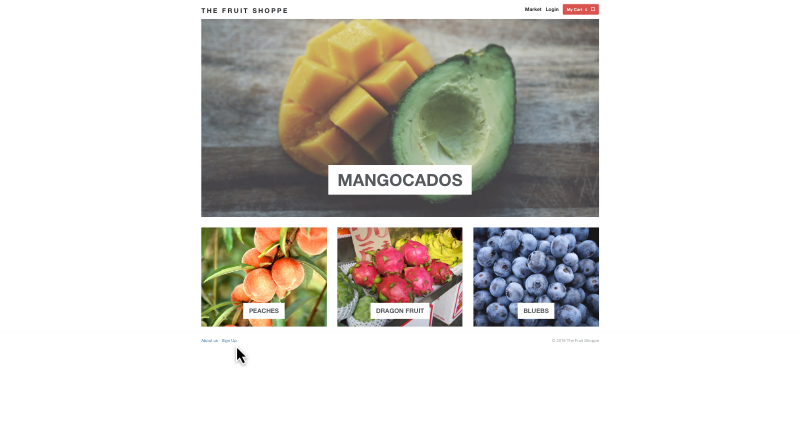
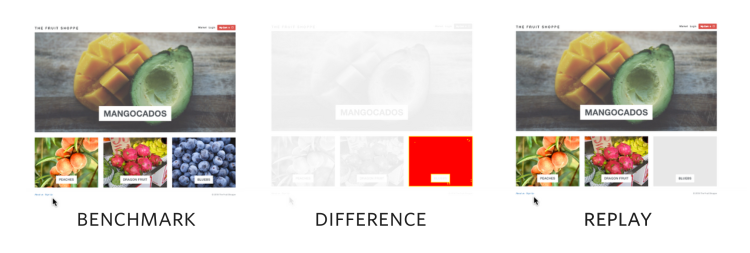
Visual regression testing uses a fuzzy image comparison algorithm to detect regressions in your code—typically changes in a program's user interface—that are very hard to notice with a normal test. To verify that the thumbnails implementation has not regressed due to any recent changes, we first generate a screenshot that has been checked by a human and certified as correct. This becomes what is known as the benchmark image.
Our benchmark image.
The benchmark image is committed to version control and lives alongside the rest of the code. Now, whenever any code is changed, the visual regression test will automatically run and check the output of the thumbnails function against the benchmark image. If the two differ beyond a low threshold, for instance a 1% difference, the test fails and the code changes are rejected.
We perform this test using the jest-image-snapshot and pixelmatch libraries to perform the fuzzy image comparison:
const toMatchImageSnapshot = configureToMatchImageSnapshot({
  failureThreshold: 0.01,
  failureThresholdType: 'percent',
  customSnapshotsDir: '__image_snapshots__',
  updatePassedSnapshot: true,
});
expect.extend({ toMatchImageSnapshot });
test('visual regression', async () => {
  const requestBody = JSON.stringify(testFixture);
  return request(app)
    .post('/thumbnails')
    .send(requestBody)
    .expect(200)
    .expect('Content-Type', 'image/png')
    .then(res => expect(res.body).toMatchImageSnapshot());
}, 30000);
What does it look like when this test fails? Imagine a bug prevents one of the images from loading inside your session playback. The difference between the two thumbnails is enough to cross the threshold and cause the test to fail. When this happens, the pixelmatch library produces a helpful image diff to aid in troubleshooting.
Above you can see the output of our visual regression test. The test compares the benchmark image (left) to the screen from the session recording (right), identifying any difference (middle image).
Without the visual regression test, this change may have passed through the continuous integration pipeline and made it into production, where it could have gone unnoticed for quite some time.
Automated testing such as this visual regression check help give us confidence that the thumbnail feature works and will continue to work into the future, even as the codebase and the product rapidly evolve.
Conclusion: Thumbs Up!
And that's how thumbnails for Fullstory are created. The interns are saved!
Of course, even with all the above going on, there’s still more happening behind the scenes than what could be covered here—things like securing, deploying, and monitoring the thumbnails code. There's a lot that goes into making Fullstory the product it is. Thumbnails may seem a small thing, but little things add up to make for big differences in the overall experience of a digital product.
I hope this small slice provides a “snapshot” into how a feature is built and implemented here at Fullstory.
P.S. We’re incredibly proud of the work we do, and want to share our love for engineering with the world. Fullstory is constantly on the lookout for others who share our enthusiasm for finding creative solutions to exceptionally challenging software problems. If that sounds like you, say "Hi." 👋
