So maybe you have an idea of what customer experience (CX) is, but you’re not sure how to measure it or what metrics and KPIs you should track. Understanding and measuring customer experience is crucial to enhancing service quality and increasing customer loyalty.
CX is more than data collection—it's about using customer analytics to make sense of the data and drive meaningful growth.
Want to sift through the clutter? Our guide breaks down six crucial customer experience KPIs, from Net Promoter Score (NPS) to Customer Lifetime Value (CLV), demonstrating how each one captures a slice of your customers' perceptions. These insights lay the groundwork for targeted, customer-first strategies, propelling your business forward.
Key takeaways
Customer experience metrics like CSAT, CES, and NPS are key for measuring customer perceptions, overall satisfaction, and loyalty, providing valuable insights to align business improvements.
Calculating core CX metrics involves simple methods; for instance, NPS is the difference in percentage between Promoters and Detractors, while CSAT is the average score from customer satisfaction surveys.
Advanced customer experience measurement techniques employ AI-driven analytics, predictive insights, and sentiment analysis to provide a deeper understanding of customer behavior and needs and behavior.
Over 50 percent of customers will switch to a competitor after a single unsatisfactory customer experience. - Zendesk CX Trends
Customer experience metrics you'll want to track
Measuring customer experience is all about understanding how customers see your brand, how happy they are with what you offer, and how loyal they feel. It's crucial to keep track of this- and that's where customer experience metrics come in. They help you align your business strategies with what your customers actually want, which can boost your performance and success.

So, what metrics should you be watching? Start with the Customer Satisfaction Score (CSAT), Customer Effort Score (CES), and Net Promoter Score (NPS). These metrics give you a full picture of customer journeys, from the moment they first hear about your brand to their interactions after a purchase.
Tracking these metrics gives you a complete picture of your customers' preferences and needs. This helps you make smarter business decisions. Ready to upgrade your strategy and build stronger customer loyalty? Let’s get a handle on these key metrics.
1. Net Promoter Score (NPS®)
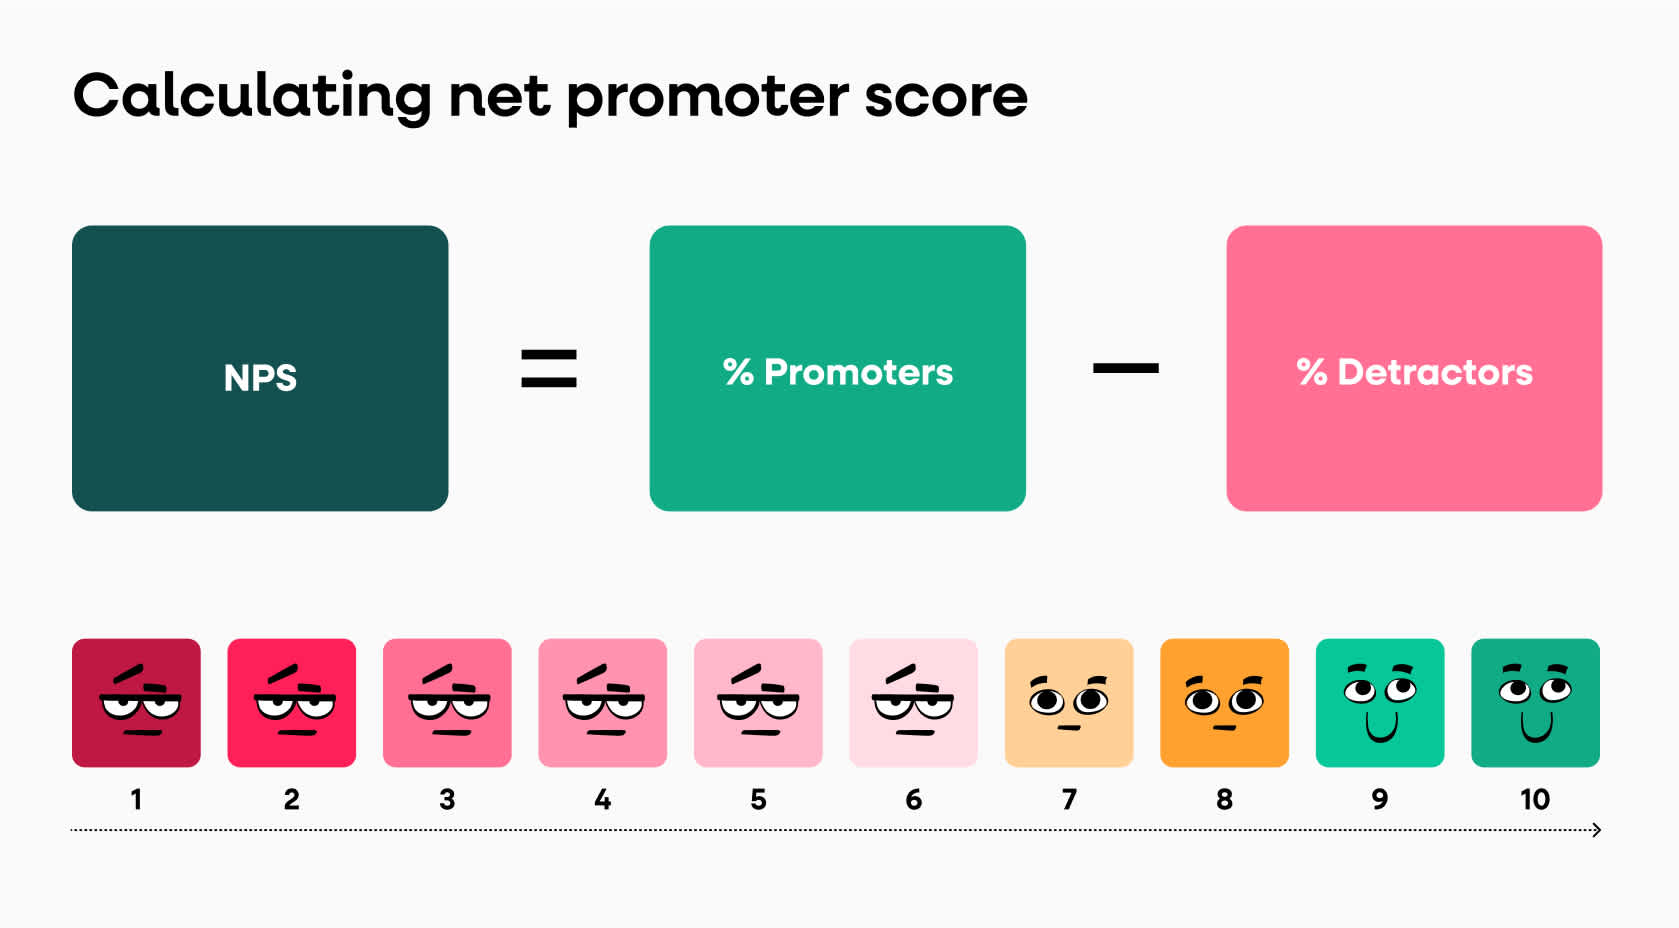
One of the cornerstone metrics in customer experience measurement is the Net Promoter Score (NPS®). But what exactly is NPS®? It’s a tool that measures how likely customers are to recommend a company’s product or service to others, serving as an index of customer loyalty. Respondents to the NPS survey are categorized based on their score: detractors score 1-6, passives 7-8, and promoters 9-10. These categories respectively indicate varying levels of customer loyalty.
Analysis of NPS and related feedback allows businesses to gauge customer sentiment towards their brand. This sentiment is indicative of potential business growth and customer advocacy.
But, how does one go about calculating NPS?
How to calculate NPS®
Calculating NPS® is quite straightforward. Customers are asked how likely they are to recommend a product or service to others on a scale of 0-10.
Respondents are then grouped into Promoters (9-10), Passives (7-8), and Detractors (0-6).
The NPS® is calculated by subtracting the percentage of Detractors from the percentage of Promoters. In other words, the higher the percentage of promoters and the lower the percentage of detractors, the higher the NPS® score, indicating a higher customer loyalty.
NPS® = [(# of Promoter scores - of Detractor scores) / # total responses] x 100
2. Customer satisfaction score (CSAT)
While NPS® measures customer loyalty, the Customer Satisfaction Score (CSAT) helps us understand how satisfied a customer is with the overall service or a specific feature within a product. Yes, the name pretty much says it all!
It’s a straightforward metric that measures customer satisfaction based on a rating scale. For instance, customers may be asked, "Overall, how satisfied were you with our service?."
On a 5-point scale in this case:
5 = Very satisfied
4= Satisfied
3 = Neutral
2 = Dissatisfied
1 = Very dissatisfied
CSAT responses aid in identifying areas of the product customers are either satisfied or dissatisfied with, thus guiding necessary adjustments. But what’s the process for calculating CSAT?
How to calculate CSAT
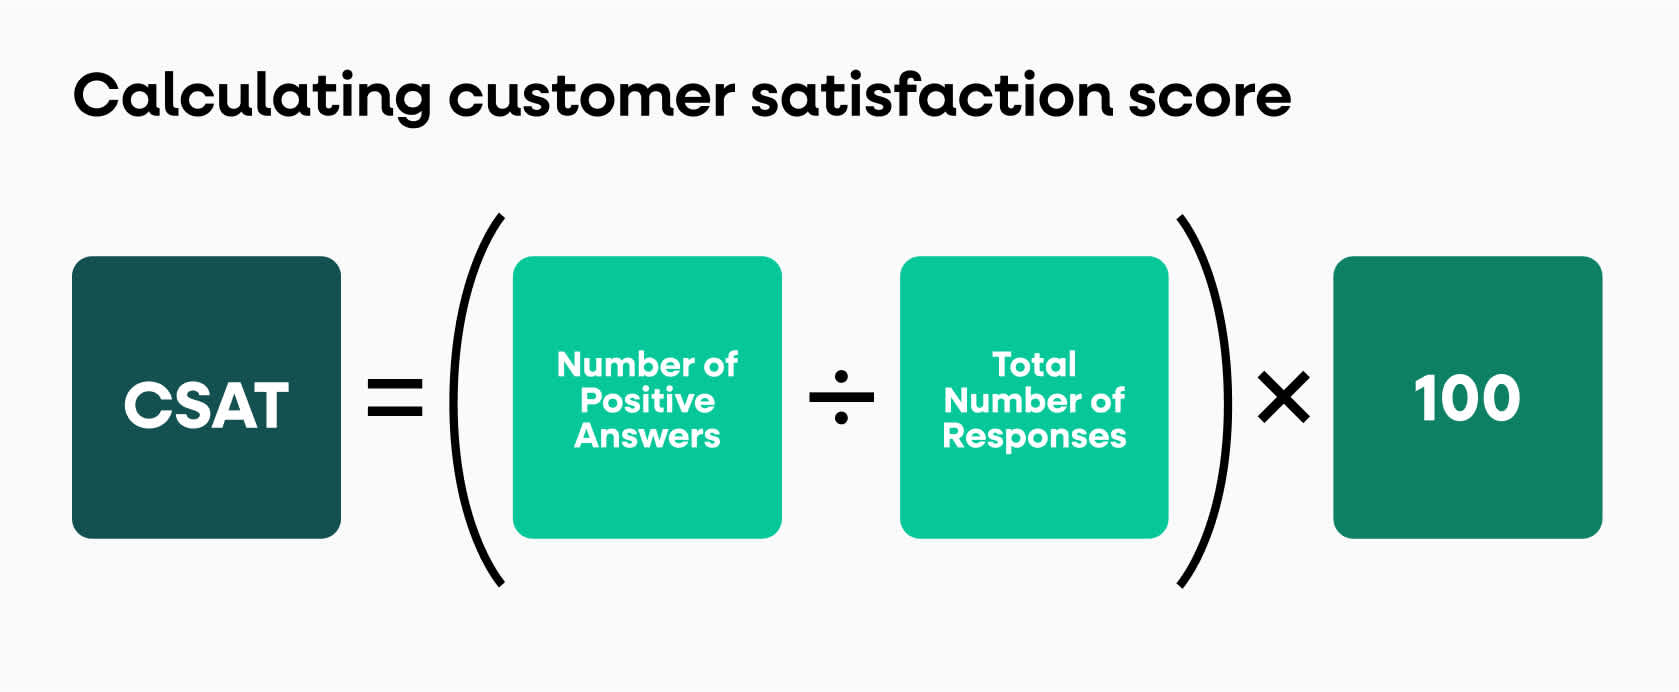
Calculating CSAT is as simple as summation and division. You sum up all the scores given by respondents and then divide it by the total number of respondents. Essentially, this gives you the average score, indicating the level of customer satisfaction.
To calculate the percentage of satisfied customers:
CSAT = (# satisfied answers / # total responses) x 100
3. Customer effort score (CES)
The Customer Effort Score is a crucial metric for gauging how smoothly your customers can interact with your business, from navigating your website to accessing support. Essentially, CES measures the ease or difficulty experienced during these interactions.
Pinpointing where your customers encounter friction is key to streamlining their experience. To measure CES, you can use different scales:
Likert scale: This involves statements customers can agree or disagree with to varying degrees, offering a broad sense of how effortless or challenging they find the interaction.
Numeric scales: These provide a more detailed view of the effort level customers perceive.
Emotion scales: Featuring emoji faces from happy to frustrated, these scales allow customers to quickly and visually communicate their experiences, enhancing the emotional clarity of the feedback.
Each method has its strengths in capturing customer effort, and your choice of scale can influence the actionable insights you gain. A low CES indicates potential trouble spots—like a cumbersome website or ineffective support—that could deter customer satisfaction and loyalty. Understanding how to calculate and interpret CES effectively is essential for any business committed to creating frictionless customer experiences.
How to calculate CES
CES can be calculated using a post-interaction survey where customers rate the ease of their experience, or by comparing the percentages of ‘Easy’ versus ‘Difficult’ responses. The lower the CES score, the higher the customer effort, meaning there’s room for improvement in a smoother customer experience.
CES = (sum of customer scores) / (# total responses)

4. Customer lifetime value (CLV)
Transitioning from the customer journey, let’s examine another significant metric, the Customer Lifetime Value (CLV). CLV measures the long-term value of customer relationships, indicating how much one customer has brought to a business over the entire relationship. In other words, it puts a value on customer loyalty and satisfaction.
An increased CLV indicates enhanced customer loyalty and satisfaction, asserting that satisfied customers tend to stay longer and contribute more revenue over time. Unlike metrics like NPS and CSAT, CLV directly correlates with revenue, highlighting its critical role in guiding marketing efforts and understanding the long-term value of customer relationships.
How to calculate CLV
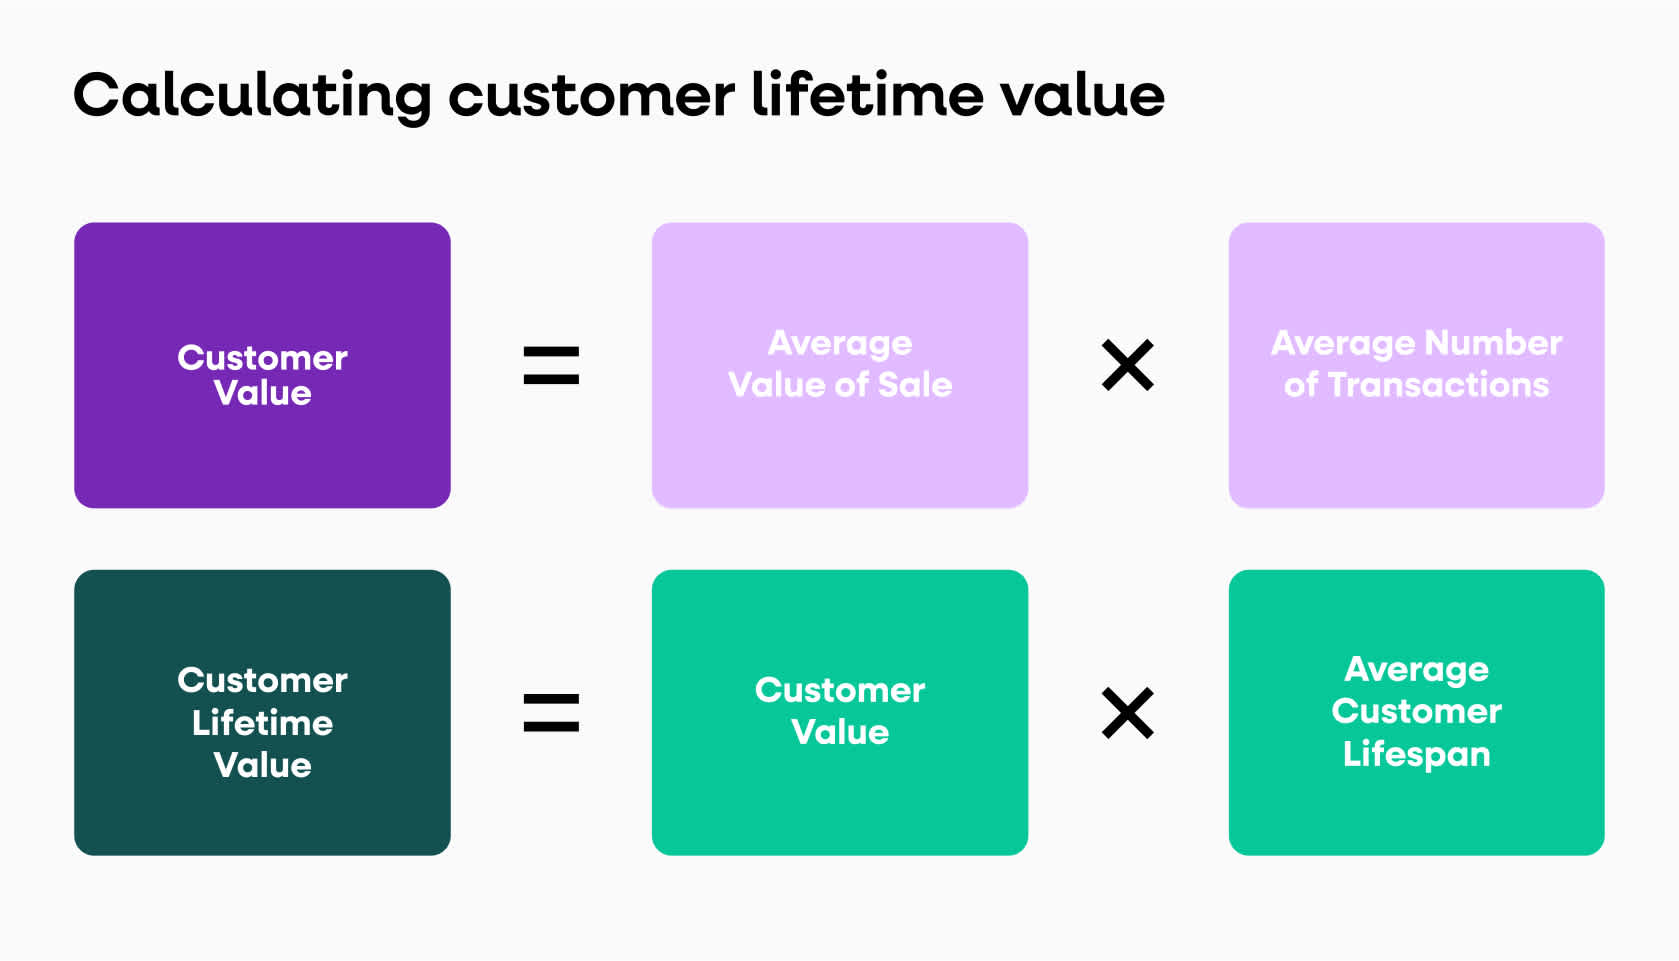
What’s the method for calculating CLV? In e-commerce, CLV is calculated by multiplying the average order value (AOV) by purchase frequency and estimating customer lifespan, thus providing a financial measure of customer satisfaction. Essentially, the higher the CLV, the more valuable the customer is to the business.
CLV = (customer value x average customer lifespan)
average customer lifespan = (sum of customer lifespan / # total customers)
customer value = (average customer purchase value x average # purchases)
5. Customer retention
Another metric that directly ties into customer loyalty and satisfaction is customer retention. Customer retention measures how many loyal customers continue using or paying for services over time, indicating customer satisfaction and loyalty.
Concentrating on retention rates can enhance customer satisfaction and loyalty, as it gauges how customers value the product over time and is ultimately more cost-effective than gaining new customers. So, how is customer retention calculated?
How to calculate retention rate
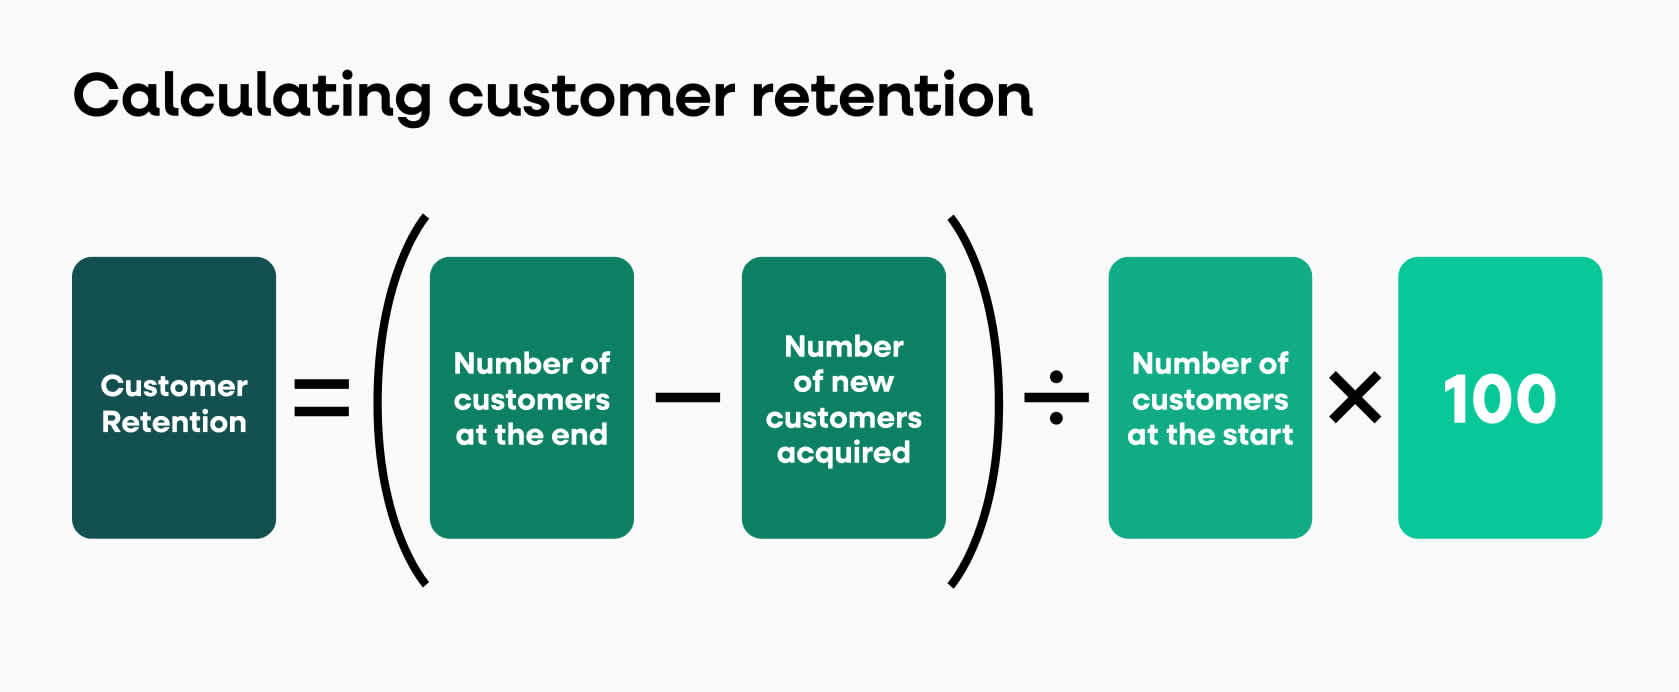
The retention rate is calculated by identifying a specific time frame (annual, quarterly, monthly, or even daily) and gathering the following customer data:
The number of customers at the end of the period
The number of customers added within the time period
The number of customers at the start of the period
This gives you the percentage of customers who have remained with your business over the specific period, indicating your success in retaining customers.
Customer retention rate = [(CE - CN) / CS] x 100
CE: # customers at the end of the period
CN: # new customers in the period
CS: # customers at the start of the period
6. Customer churn
It’s crucial not only to attract customers but also to keep them. That’s where understanding customer churn becomes essential. Customer churn rate measures the percentage of customers who stop using or purchasing from a company over a specific period. It’s a key metric to gauge your business’s ability to retain customers.
Monitoring churn rate helps you pinpoint how effective your customer retention strategies are. While a “good” churn rate can vary depending on the industry, it typically ranges between 2% and 8%.
How to calculate churn rate
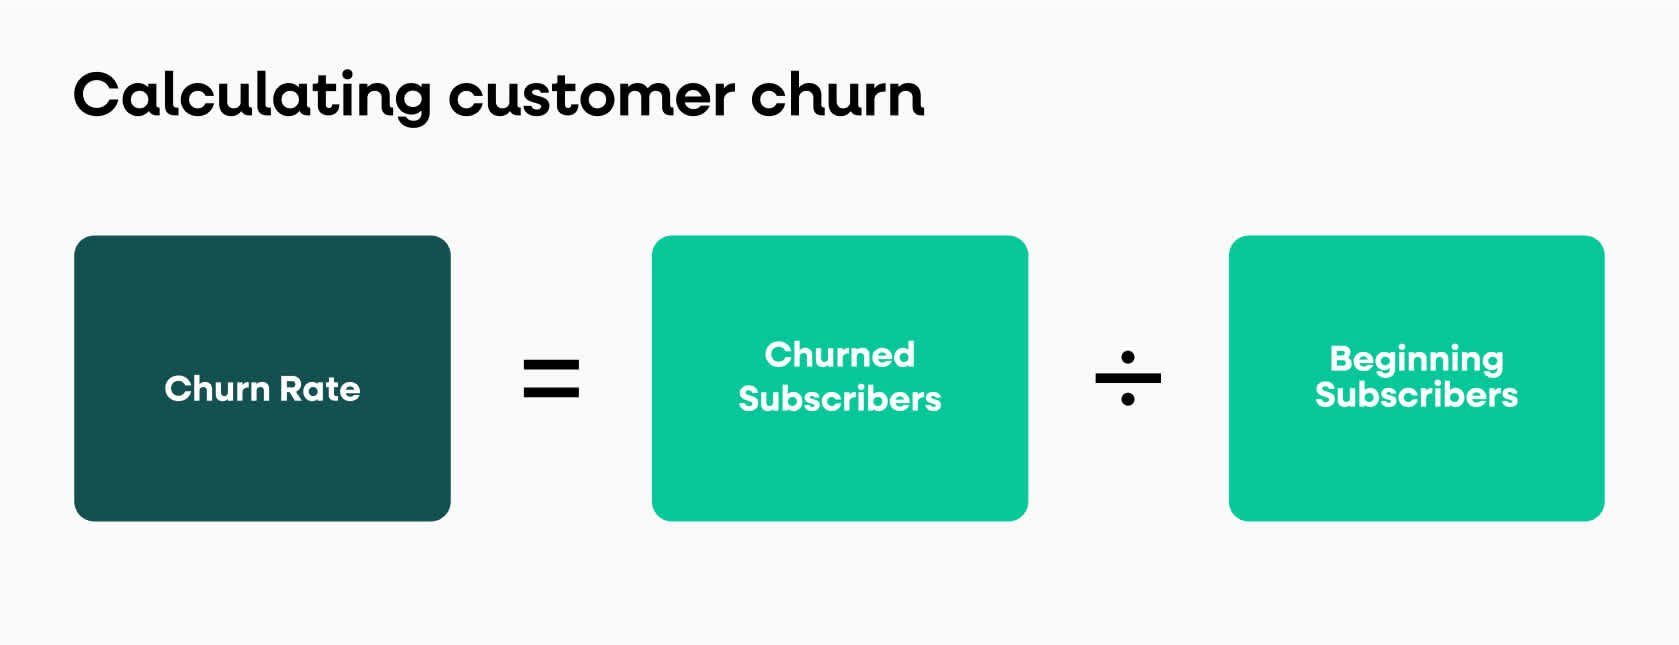
The formula for churn rate is straightforward:
(lost customers ÷ total customers at the start of the month)×100
For example, if you started the month with 100 customers and lost 5 by the end of it, you would divide 5 by 100, resulting in 0.05. Multiply 0.05 by 100 to get a 5% monthly churn rate.
This calculation clearly indicates how many customers your business is losing, suggesting when you may need to adjust your retention strategies.
Customer churn rate = (lost customers / starting # customers)
How to collect customer experience data
Collecting customer experience data is key for businesses aiming to enhance their services and products. Accurate feedback allows organizations to understand customer sentiments and behaviors, leading to better decision-making that can boost customer satisfaction and business performance.
Let's take a look at how you can use different feedback channels to understand the customer journey and make specific improvements clearly.
Partner with a behavioral data platform
For businesses aiming to enhance customer interactions and better understand user behavior, considering a behavioral data platform could be a game-changer.
Behavioral data platforms like Fullsto offer a sophisticated way to track and analyze customers' interaction with your digital services—from clicks to swipes to scrolls. This detailed observation helps businesses identify areas for improvement that can significantly boost customer satisfaction and loyalty.
Here’s what a partnership with a behavioral data platform can bring to your business:
Rich customer insights: Capture precise details of user interactions, providing clarity on where to focus improvements for maximum impact.
Boost Customer Lifetime Value (CLV): Tailor customer experiences based on detailed behavioral data, potentially increasing engagement and retention.
Enhance loyalty and retention: Use insights to understand and replicate successful interactions, cultivating deeper customer loyalty.
Drive product development and innovation: Direct product enhancements and innovations that resonate well with users, as informed by real-time usage data.
Elevate customer satisfaction: Address and resolve user pain points efficiently, leading to higher satisfaction and better overall product experiences.
By engaging with a platform that provides comprehensive behavioral insights, you're equipped to deliver superior customer experiences, effortlessly identify your most valuable customers, and proactively manage potential customer issues.
Consider how these capabilities can transform your approach to customer engagement and drive your business forward.
Surveys and direct feedback
Surveys are a primary tool used by organizations to collect data regarding customer engagement with a brand, including customer expectations, attitudes, and satisfaction. Customer opinion surveys focus on customers’ self-stated feelings or perceptions towards a brand or product, which is vital for understanding the customer experience.
Social media posts and reviews
In addition to surveys, social media posts and reviews offer another channel to gather unsolicited feedback and insights into customer sentiment. Encouraging customers to provide unsolicited feedback in their own words can yield more specific and constructive insights.
Talk with your team
Engaging directly with your teams—particularly those in customer-facing roles like sales, support, and service—can provide invaluable insights into the customer experience that data collection tools may not capture. These employees are on the front lines, interacting with customers daily, and they can offer detailed, qualitative feedback based on their firsthand experiences.
Measure customer experience and sentiment with behavioral data
So, we've covered key customer experience metrics that help you track customer interactions from their first experience to their ongoing loyalty.
Integrating customer feedback can refine your strategies, boost service quality, and strengthen customer loyalty. Ready to see how these metrics can transform your business approach?
Frequently asked questions
What are the top customer experience KPIs?
Customer experience KPIs include Net Promoter Score (NPS), Customer Satisfaction Score (CSAT), Customer Effort Score (CES), Customer Retention Rate, Customer Churn Rate, and Customer Lifetime Value (CLV).
What is an example of customer experience?
A customer experience example is a visit to a coffee shop where the customer is greeted warmly, finds the ordering process efficient, enjoys a clean and inviting environment, appreciates the quality of the coffee, and receives a loyalty card for future rewards.
What is the difference between CSAT and CES?
CSAT (Customer Satisfaction Score) assesses overall customer satisfaction with a product or service using a rating scale, while CES (Customer Effort Score) evaluates the ease of customer interactions, focusing on the effort required from the customer.
How can a business leverage customer feedback for improvement?
Businesses can use customer feedback to identify areas of dissatisfaction, enhance products or services, improve customer service, personalize interactions, and track improvements over time to see if changes positively impact the customer experience.
Want to find out where your company stands with behavioral data? Download the Fullstory Data Maturity Matrix and take our quiz to find out.
